
The Data Lab Community’s Data Visualisation Competition returns for 2025. Data viz enthusiasts are encouraged to participate in the 2025 The Data Lab Community‘s competition. Tell the story of the hidden benefits of climate action to our health, community and beyond. Whether you are a seasoned data viz pro or just getting started, this competition […]
data visualisation
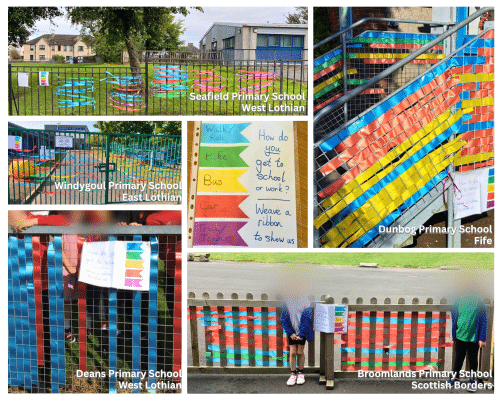
Scottish primary schools win international data visualisation competition
Five Scottish primary schools have won The Data Lab’s inaugural Data Visualisation competition. Announced today at Data Summit, The Data Lab’s flagship conference, it was revealed that the schools in East Lothian, Fife, Scottish Borders and West Lothian collectively scooped the top prize in the competition which garnered entries from around the world. Their entry […]

The Data Lab Community announces a new data visualisation competition
The Data Lab Community’s Data Visualisation Challenge has landed! We’re looking for everyone from seasoned data visualisers who know D3 and Tableau like the back of their hands to those looking to dip their toes into this exciting craft for the first time. Entering the challenge will allow you to take your skills to the next level, demonstrate your abilities and raise your profile in front of a global data and AI community.

The data of Zelda and the future of the gaming industry
By Marta Monellini, Marketing and Communications Assistant From Hogwarts to Hyrule – the entertainment industry has a new king! Until last week Hogwarts Legacy held the crown for the biggest boxed video game release of 2023, despite active boycott pledges and controversy. However, on Friday, Nintendo released Zelda: Tears of the Kingdom, bringing the crown […]

A Brief Profiling of Data Professions
Do you recall how many times you’ve read articles titled “This is what a Data Scientist does” or “Differences between a Data Scientist and a Data Analyst”? Such articles usually come with various colourful (and sometimes funnily shaped) Venn diagrams, arbitrarily presenting the overlap of the various data professions and highlighting the distribution of different […]
Four tips for creating interactive visualisations with Shiny
I’ve recently presented a toy Shiny app at the Edinburgh Data Visualization Meetup to demonstrate how Shiny can be used to explore data interactively. In my code-assisted walkthrough, I began by discussing the data used: a set of records detailing customer purchases made on Black Friday (i.e., each customer was given a unique ID, which was repeated […]
Review of the Data Visualisation Workshop with Andy Kirk: The art of data storytelling
Last month The Data Lab was very pleased to partner with data visualisation guru Andy Kirk on a one-day workshop at the G&V Royal Mile Hotel in Edinburgh, as part of our mission to bring leading data experts to the Scottish community. My colleague Caterina Constantinescu and I were in attendance, along with around forty […]