In our latest guest blog, Kristian Feherek, Applied Data and AI Scientist at The Data Lab, explores how the same data can tell two completely different stories. Using a survey of just 20 Brooklyn residents, Kristian shows how charts, colours and carefully chosen statistics can turn a tiny dataset into two opposing narratives. He reveals how easily data visualisation can influence what we believe, and why we should always look beyond the pretty charts.
How the same 20 survey responses can tell two completely opposite stories — and why you should care.
The experiment
I took a tiny pizza survey from Brooklyn — just 20 respondents answering questions about cheese, culture, safety, and community — and built two dashboards from the exact same data.
One makes you want to open a pizzeria tomorrow. The other makes you want to shut them all down.
Neither is lying. Both are misleading.
The optimistic take
“Brooklyn LOVES pizza. It’s cultural, it’s community, it’s safety. Open your pizzeria TODAY!”
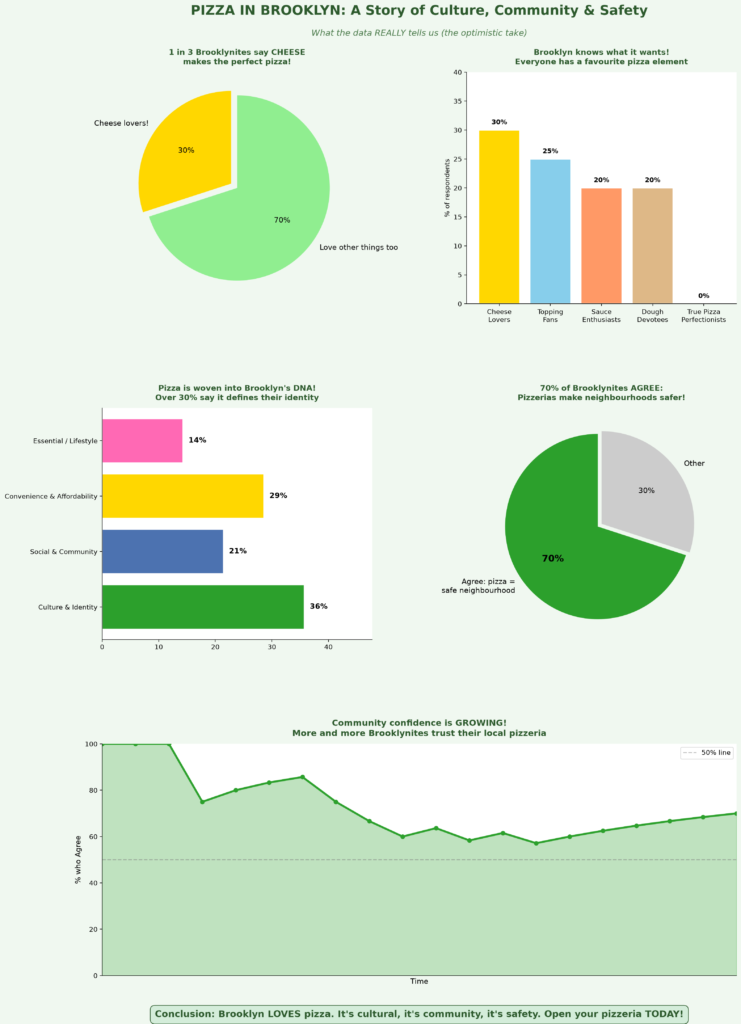
Techniques used to spin this narrative:
- Grouped “Agree” + “Strongly agree” together to get an impressive 70%.
- Highlighted cheese as the #1 choice (“1 in 3!”) while ignoring it’s only 35%.
- Framed the 30% culture figure as pizza being “woven into Brooklyn’s DNA”.
- Plotted a rising “confidence” trend against a vague “Time” axis, with no dates or numbers to reveal it covers just a few hours.
- Used green colours, a pulled-out highlight slice, and celebratory language throughout.
The pessimistic take
“Brooklyn’s pizza obsession is OVERSTATED. Most people aren’t convinced. Think twice before opening a pizzeria!”
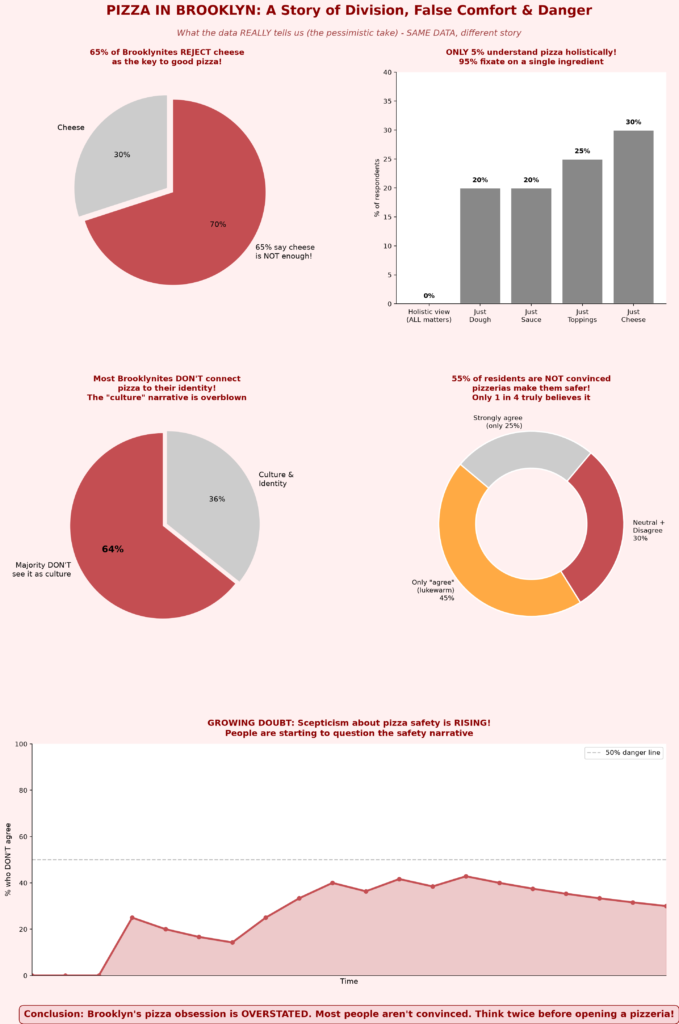
Techniques used to spin this narrative:
- Flipped the same 35% cheese stat into “65% REJECT cheese”.
- Separated “Agree” from “Strongly agree” to make support look fragile — “only 1 in 4 truly believes it”.
- Reframed 30% culture as “most DON’T connect pizza to identity”.
- Plotted the same timeline against the same vague “Time” axis, but tracking the doubt percentage instead.
- Used red colours, exploding slices, and alarming language throughout.
The reality check
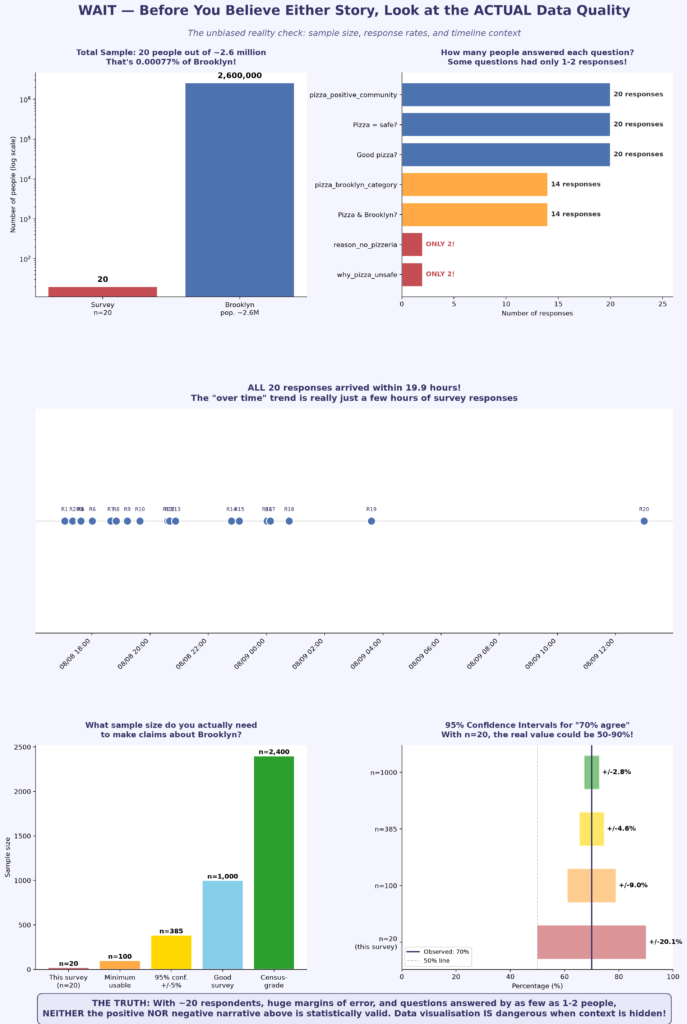
“With ~20 respondents, huge margins of error, and questions answered by as few as 1-2 people, NEITHER narrative is statistically valid.”
What both dashboards hid from you:
- The entire survey had 20 people — out of Brooklyn’s 2.6 million residents.
- Some questions were answered by only 1 or 2 people, yet we showed percentages as if they meant something.
- All responses arrived within a few hours, but we presented them as a “trend over time” and hid the timestamps behind a generic “Time” label.
- With n = 20, the margin of error on “70% agree” is ± 20% — the real value could be anywhere from 50% to 90%.
What to watch for
The next time you see a data-driven post, infographic, or news article, ask yourself:
- How many people were actually surveyed? Percentages from 20 people are not the same as percentages from 20,000.
- What was grouped together — and what was split apart? “70% agree” and “only 25% strongly agree” are both true. The framing is the manipulation.
- What does the axis actually show? An axis labelled just “Time”, with no dates, can hide that the “trend” covers only a few hours.
- What was highlighted — and how? Exploded slices, donut cut-outs and bright colours tell you where to look before you’ve read a single number.
- What colour choices were made? Green = good, red = bad is not neutral. It’s persuasion.
- Who benefits from this narrative? Every chart has an author. Every author has a perspective.
- Where is the raw data? If you can’t see the source, you can’t verify the claim.
The bottom line
Data visualisation is one of the most powerful communication tools we have. But power without responsibility is dangerous. A skilled data scientist can make the same dataset argue for or against almost anything — not by changing the numbers, but by choosing what to show, what to hide, how to group, how to colour, and how to label.
Be curious. Be sceptical. Ask for the sample size. Ask for the raw data. And never let a pretty chart do your thinking for you.
The source data
Don’t take my word for it — you can inspect and download the raw 20-row dataset yourself by clicking here.
Special thanks and acknowledgement to Sangeetha Sasikumar, who collected and published this survey dataset.