Machine learning algorithms are currently applied in multiple scenarios in which unbalanced datasets or overall lack of sufficient training data lead to their suboptimal performance. For example, approaches focusing on disease prediction are often affected because data in the health sector is generally difficult to acquire and disease training examples are limited. Fraud detection in banking also suffers due to limited number of fraudulent transactions for training. Other examples involve complex machinery fault diagnosis, oil spills detection or natural disaster prediction.
Multiple approaches attempting to combat this issue have been developed and using synthetic data is one of them. This type of data is artificially generated rather than collected and based on real events. It is useful in improving machine learning because it can provide additional training examples, but synthetic data has also been used to validate mathematical models, combat issues related to dealing with sensitive data and to test software without taking real data out of production. Artificially created data can also be helpful in cases when labelling immense amount of data is too time-consuming and not cost effective. There are multiple packages, websites and algorithms allowing its creation, such Synthpop R Package, Generative Adversarial Networks (GANs) or variational autoencoders.
Synthetic data has multiple potential applications, but the big challenge is assessing whether the generated dataset is useful. Artificially created data can follow the same statistical distribution as the real dataset, but will it behave the same way when used to build algorithms? Will the generated data add any valuable information to the model and allow it to perform better? To answer these questions one can use multiple methods which can be divided into assessment focusing on data’s statistical properties or relationships between the variables and assessment aiming to evaluate the way in which data affects the performance of algorithms.
Quality evaluation based on statistical properties
The simplest way of comparing real to synthetic data is plotting its distribution in form of histograms and scatter plots. This approach however does not provide a quantitative measure of data quality.
Measures such as histogram intersection or Kalmogorov-Smirnov test can be used to assess the similarity between the distributions, but the weakness of these approaches is that one may not necessarily aim at producing synthetic datasets with distributions identical to those of real data. Simply copying the real dataset would provide excellent results based on this measure, but the important part is the usefulness of generated data in improving machine learning algorithms. Theoretically, generating new points, different to those in the real dataset could benefit the algorithm training process by introducing new information and so modelling the data as closely as possible may not be the best solution.
Another synthetic data quality assessment approach is comparing pairwise Pearson correlations in the real dataset variables to those of synthetic dataset variables [1]. This measure allows to quantify the association between two data groups or variables. The difference between Pearson Correlations for real and synthesised variables can then be calculated – the lower the value, the more similar the associations between the two datasets.
Quality evaluation based on practical utility
Random forest feature importance scores[2] can provide valuable information about the extent to which algorithms use similar predictive features. The scores provide information about which features consist of most valuable information in terms of allowing the random forest to separate data into classes. Ideally, features in the synthetic dataset would be equally important to those from the real dataset. This measure can be summarised in one number corresponding to the mean distance between real and synthetic datasets’ importance scores.
Synthetic ranking agreement[3] is a method focusing on the importance of any two algorithms trained on the synthetic data having similar relative performance to the same algorithms trained on the original data. This is particularly relevant when researchers want to obtain the best performing algorithm without sharing the original dataset. Choosing algorithms or tuning hyper parameters is a stepwise process and usually done over time, it is therefore important that not only the best, but any of the compared algorithms are seeing similar improvement or deterioration in performance. If the synthetic data influences the performance of algorithms in the same way as the original, the final algorithm chosen relying on synthetic data would be the same as the one chosen using real data. This measure outputs a number with the maximum value of 1. High values mean that synthetic data behaves similarly to real data when trained on various machine learning algorithms.
Propensity score[4] is a measure based on the idea that the better the quality of synthetic data, the more problematic it would be for the classifier to distinguish between samples from real and synthetic datasets. Propensity score is the probability of a given data point being assigned to a particular class – low scores mean data of good quality.
| Evaluating statistical properties | Evaluating practical utility |
| Histograms and scatterplots | Random Forest Feature Importance Scores |
| Histogram intersection, K-S test, etc. | Synthetic Ranking Agreement |
| Pairwise Pearson Correlation | Propensity Score |
Example data quality assessment and its effect on random forest performance
The dataset used in this example is Credit Card Fraud dataset available on Kaggle (https://www.kaggle.com/mlg-ulb/creditcardfraud), it consists of 492 fraud transactions and 284 807 normal transactions described by 31 numerical variables.
Various data generators were used: Synthpop R Package, GAN, conditional GAN (cGAN), Wasserstein GAN (WGAN), Wasserstein conditional GAN (WcGAN) and Tabular GAN (TGAN) [5]. Data quality was assessed using methods mentioned above (see fig 1.). The improvement of random forest performance was measured by adding varying number of fraud examples to real data consisting of 5381 normal and 381 fraud transactions and obtaining a random forest model for each of the conditions (see fig 2.). Models were then evaluated on test data by measuring precision and recall. This example showed that generators performing best based on data quality measures correlated with the highest improvement in random forest performance. This assessment was performed to investigate the relationship between quality evaluation and random forest performance improvement and not in order to choose the best data generator. Optimizing GANs further could lead to their better performance.
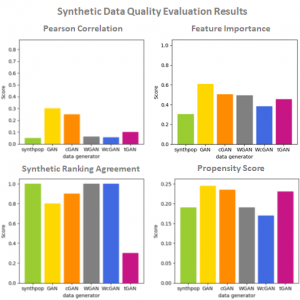
Fig 1. Results of synthetic data quality evaluation performed on Credit Card Fraud dataset.

Fig 2. Random forest performance assessment.
Summary
Synthetic data has the potential to increase the performance of machine learning, especially in case of unbalanced datasets. Measures described here can be used to evaluate the quality of generated data and are indicative of its practical utility.
GitHub: https://github.com/amarek1/MSc-Project
References:
1. Kaloskampis, I. Synthetic data for public good. 1–24 (2019).
2. Beaulieu-Jones, B. K., Wu, Z. S., Williams, C. & Greene, C. S. Privacy-preserving generative deep neural networks support clinical data sharing. doi:10.1101/159756
3. Jordon, J., Yoon, J. & van der Schaar, M. Measuring the quality of Synthetic data for use in competitions. (2018).
4. Snoke, J., Raab, G., Nowok, B., Dibben, C. & Slavkovic, A. General and specific utility measures for synthetic data. (2016).
5. Xu, L., Veeramachaneni, K. Synthesizing Tabular Data using Generative Adversarial Networks. (2018).
Hi, I am looking for a copy of Anna Marek’s master thesis on synthetic data. Where can I find it? If it is not available on the web, could you pls send it to me at ### ?
Thanks in advance.
Best wishes
Marina Santini (PhD)
Dear authors,
this is a highly interesting topic, thank you very much for this clarifying post. Coming from the academic side of the health care sector, i was wondering if the authors could recommend specific methods or software for generating synthetic data with statistical features that match those of the original data.
Best, BR
Hi BR,
I’m not entirely sure what you’re asking. The article mentions several ways to generate synthetic data, as for example: “There are multiple packages, websites and algorithms allowing its creation, such Synthpop R Package, Generative Adversarial Networks (GANs) or variational autoencoders.”
These are readily available algorithms, packages and approaches. However, they do have to be applied to a particular context through the analyst’s own knowledge and can require substantial technical skills to apply, although there are sources online that can help, such as https://research.aimultiple.com/synthetic-data-generation/
It may be that the reason you’re asking the question is because you’re looking for something a bit more user friendly? If that’s the case, I’m afraid I’m not really aware of a software tool out there that can support synthetic data creation. There are attempts to make machine learning a bit more accessible and automated, such as https://mostly.ai/ or https://bigml.com/, but I don’t have any experience of using that sort of tool to generate synthetic data. It may also be that the machine learning packages in tools like Matlab — which includes a lot more user interface capability as compared to R or python — might offer some direct user support which might help.
I’m not sure whether any of that was useful, but I do wish you luck in your endeavours.
Joanna
Dear Joanna, thank you very much for your answer. You have read my thoughts that circle around the question how do achieve such support synthetic data creation in a user-friendly way and “on demand”. Anyhow, you pointed my lab in the right direction, thank you very much.
BR
Hi BR,
I would also look into Gretel (https://gretel.ai/) and Hazy (https://hazy.com/).
Best,
K